
SU and SBS Public Disclosure (AY2018)
In accordance with AACSB International’s 2013 Standard 4 [Student Admissions, Progression, and Career Development], Sogang Business School created and posted its public disclosure statistics on the student admission competitiveness, graduation ratio, job placement ratio, and several others, related with the school’s UG and G students. All the disclosures are based on the figures and ratios for the school’s AY2018 (from March 2018 to February 2019), but we indicated specific time frames, such as current snapshot and dated snapshot, if needed.
This school introduces, first, the overall student statistics and performance indicators of Sogang University, the broader institution of SBS, to introduce its positioning in the higher-education sector in this country. Next, we introduce key student performance measures of Sogang Business School.
Our introduction of Sogang University’s UG student-related disclosures are captured (and slightly edited for a better reading) from the Center for Higher Education Information Disclosure (its website is named ‘the Higher Education in Korea”), organized and operated by the country’s higher-educational self-regulatory organization, Korea Council for University Education (KCUE). All the disclosures are validated by this organization.
| 1. Incoming Student Recruitment Rate (2018)
*Recruitment Rate = (Students enrolled/Incoming student quota) x |
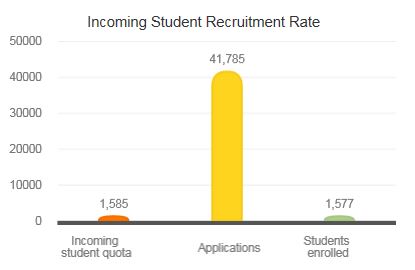
※ In Korea, each college has the fixed number of students quota, which is approved by the government
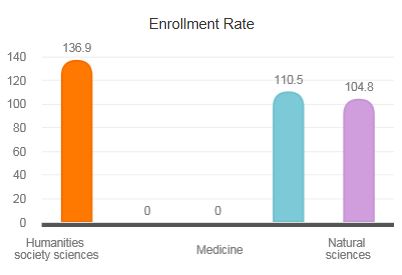
| 2. Enrollment Rate (2018)
*Enrollment Rate = (Enrolled/Quota) x 100(%) |
3. International Student Admissions Procedure and Schedule (2018)
International Students (2017)
Degree-earning Students | Language training | Exchange, Visiting Students | Total | |||||||
Total | Humanities & social sciences | Natural sciences | Engineering | Arts & physical education | Medicine | Partner institution exchange students | Visiting students | Other | ||
752 | 712 | 13 | 27 | 0 | 0 | 815 | 313 | 7 | 0 | 1.887 |
※ Above indicators used different definitions, methodology compared to what has been used in the Education at a Glance(EAG) published from OECD.
4. Exchanges with Overseas Universities (2017)
Students sent | Students received |
359 | 458 |
5. Student Scholarship Recipients (2017)
*unit: one-thousand (1,000) KRW
Total enrolled | External sources | Internal sources | Total | scholarship per one student | ||||||
Central government | Local government | Other | scholarship of excellence | scholarship of lower-income group | scholarship of work labor | scholarship of voluntary service | Other | Amount | ||
Amount | Amount | Amount | Amount | Amount | Amount | Amount | Amount | |||
7.812 | 9,780,179 | 47,971 | 1,951,598 | 1,784,779 | 4,937,495 | 1,801,529 | 33,143 | 1,582,010 | 21,918,704 | 2,805.8 |
6. Graduate Employment (2018)
Total enrolled | Employed with Health Insurance through the company | Working abroad | Agriculturist | Creative activity | Sole proprietor | Freelancer | Advanced into higher schooling | Graduates entering military | Unable to Work | Foreign students | People with exception | Other | Unknown | Employment rate (Linked with Health Insurance Database)(%) | |||||||||||||
M | F | M | F | M | F | M | F | M | F | M | F | M | F | M | F | M | F | M | F | M | F | M | F | M | F | ||
1.232 | 0.44 | 672 | 497 | 0 | 2 | 0 | 0 | 0 | 0 | 7 | 2 | 25 | 31 | 180 | 122 | 5 | 3 | 1 | 10 | 16 | 4 | 2 | 219 | 232 | 12 | 13 | 67.3 |
Disclosures for SBS Admissions, Enrollments, Graduates, (Employment Ratio)
SBS UG Student Status (as of 2018)
| 1. Intake¹⁾ | |
UG | |
First-year Intake | |
Applicants | 7,188 |
Admission Offered1) | 274 |
Admission Accepted1) | 373 |
| 2. Current Enrollment2) | |
| UG |
| Total Students | 1,601 |
| 3. UG Graduates3) | |
| UG | |
| Total Students | 285 |
| 4. Employment Ratio4) | |
| SBS UG | |
2014 | 81.2% |
2015 | 81.0% |
2016 | 74.0% |
2017 | 71.1% |
¹⁾ ”Admission Offered” indicates the number of students who, in origin, have taken steps to get admitted into SBS and have been offered admission according to the government-set admission quota, while “Admission Accepted” number shows that of the students who have been offered admission and those who have accepted the admission. The number of Admission Accepted is larger than Admission Offered because the university has its own discretion to recruit students of ethnic Korean and other international students, academically underprivileged students. Student selectivity is one of the key strengths of SBS among top business schools in Seoul as the admission competition ratio is 4~5 to 1, indicating only one out of four to five high-school graduates makes the admission into SBS.
²⁾ “Current Enrollment” includes students attending school and those who have taken temporary leave of absence.
³⁾ UG Graduates are the students who graduated the school by the end of its academic year, which is February 2018. The graduates include those who graduated in August 2017, which is the mid-point of the school’s AY 2017.
⁴⁾ In the academic circle in the country, the “Employment Ratio” indicates that of students who landed a job among the total graduates. The employment ratio for SBS UG graduates is largely deemed to be the highest among top-level business schools in Seoul.
SBS Master’s and Ph.D Student Status as of AY2017
1. Intake | ||||||
Full-time MBA (SIMBA) | Part-time MBA (Pro-MBA) | FEMBA | MS | GSM | Ph.D. | |
Admission Competition | ||||||
Applicants | 34 | 143 | - | 27 | 15 | 123 |
Admission Offered | 22 | 118 | - | 11 | 7 | |
Admission Accepted | 16 | 67 | - | 10 | 4 | |
| 2. Current Enrollments | ||||||
Full-time MBA (SIMBA) | Part-time MBA (Pro-MBA) | FEMBA | MS | GSM | Ph.D. | |
| Total Students | 24 | 127 | 16 | 54 | 36 | 60 |
| 3. Graduates | ||||||
Full-time MBA (SIMBA) | Part-time MBA (Pro-MBA) | FEMBA | MS | GSM | Ph.D. | |
| Total Students | 16 | 69 | 10 | 20 | 10 | 8 |
| 4. Employment | ||||||
Full-time MBA (SIMBA) | Part-time MBA (Pro-MBA) | FEMBA | MS | GSM | Ph.D. | |
2013 | 61% | 100% | 100% | 60% | 67% | |
2014 | 49% | 100% | 100% | 0% | 43% | |
2015 | 40% | 100% | 50% | 33% | 79% | |
2016 | 33% | 100% | 100% | 100% | 50% | 23% |
2017 | 68.0% | 100% | 100% | 63.2% | 86.0% | 67.0% |
¹⁾ Both Pro-MBA and FEMBA students are mid-level corporate managers. Thus, their employment rates are 100%.